Click to Add to Favorites
As discussed in class, I recommend using Deadlines versus Finish No Later Than constraints. Why? Because Deadlines are flexible – they do not override Microsoft Project’s ability to schedule and calculate a finish date. Some constraints, the inflexible ones, override Projects ability to schedule and calculate new Start and Finish dates which can result in schedule inaccuracies.
Note: Deadlines are set up in the Task Information window on the Advanced Tab and are indicated by an Arrow on the Gantt Chart:
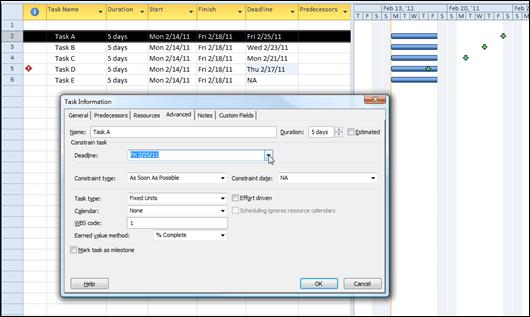
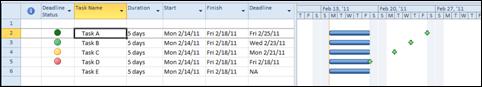
So now that we know we want to use a Deadline for any task that must be completed by a certain date, there’s an issue that needs to be addressed. With Deadlines, we only get a warning once we’ve actually missed one - so that means we constantly have to be reviewing our deadlines to see if any are approaching (See the red warning symbol under the indicator column for Task D above).
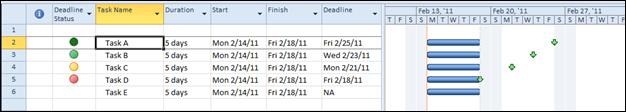
One of the tools that I have found useful is to create a Deadline Traffic Light column which displays Green, Yellow, or Red indicators depending on the timing of a task’s finish date versus its Deadline date. Take a look at the Deadline Status column below, which makes it very easy to monitor approaching (or past) deadlines:
Click to view this Tip as a PDF document
Follow these steps to create your own Deadline Status column:
1. Open a project with Tasks that have deadlines, or just use my sample file.
Sample File: ProjectTrafficLights.mpp
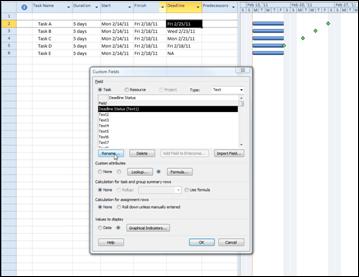
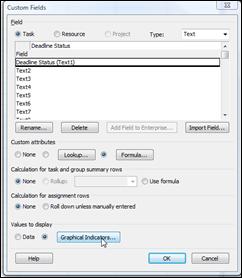
2. Open the Custom Fields Window:
2003 / 2007 Users:
Tools > Customize > Fields
2010 Users:
Project > Properties > Custom Fields
3. Rename the “Text1” custom field to “Deadline Status”.
Select Text1 and press Rename. Rename the field to “Deadline Status”.
4. Next we need to add a formula which calculates the number of days between a Task’s Finish Date and it’s Deadline Date:
Make sure Deadline Status (Text1) is still selected and press the Formula button.
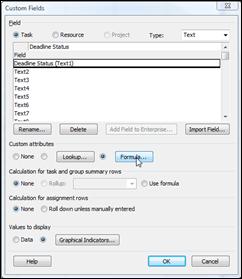
Now add the following formula and press OK:
IIf([Deadline]>99999,"None",DateDiff("d",[Finish],[Deadline]))
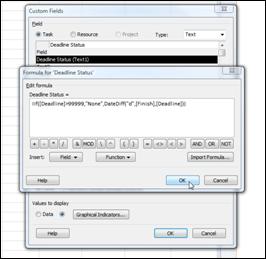
Note: The “iif” in the function above is not a typo, that is the correct spelling.
5. Next we need to update the Green-Yellow-Red Graphical Indicators for this column:
Make sure Deadline Status (Text1) is still selected and press the Graphical Indicators button.
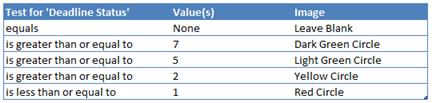
Now update the field with the warning day values and select the desire image.
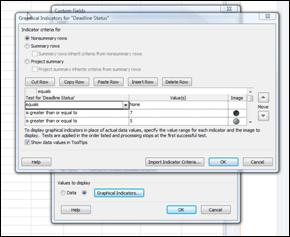
I used the following settings for my example:
6. The final step is to display your newly created custom column in your Gantt Chart view.
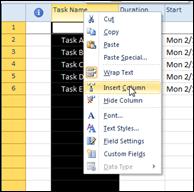
To Insert a column, just Right-Click on the Task Name column and select Insert Column, and choose the ‘Deadline Status (Text1)’ field from the list.
Your column will look like the one below. Now experiment with different Deadline dates to test your column.
This Tip is provided by Tom Baker, Director of Consulting at Excel Solutions Team. Tom has over 10 years training and consulting experience, and has been a user of Microsoft Project since the 1998 version. |


