|
Excel Boot Camp:
PivotTables & Dashboards
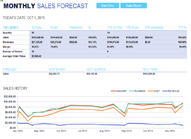
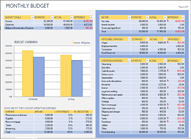
Create interactive management reports using PivotTables, PivotCharts, and other additional Excel features.
Do you want to learn more than the basics of PivotTables? Do you want to learn how to use PivotTables and other Excel Features to easily provide powerful analysis and reports?
In this course, students will go beyond the basics of PivotTables and PivotCharts to cover many lesser known PivotTable features, as well as tips and tricks every PivotTable user will want to know. Additionally, after enhancing the student's knowledge of PivotTables and PivotCharts, students will learn about other formulas and features that they can use to create interactive high-level management reports.
You will be able to import data from an external source into excel, create macros to make your cleaning up process faster, and visually represent complicated data into all kinds of interactive reports.
To ensure your success, each student should have a general knowledge of Excel PivotTables and basic Excel formulas. Feel free to contact us to discuss if this level is right for you.
|
| Hands-On Training |
Quick Reference Guides |
CPE Credits |
| Instructor-Led Courses |
Courseware Book |
Lunch |
| Email Support for Questions |
Practice Files |
Free Giveaways |
|
|
| • |
You will learn advanced, in-depth features of PivotTables |
| • |
Tips, tricks, and shortcuts |
| • |
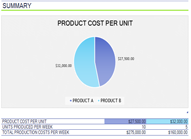
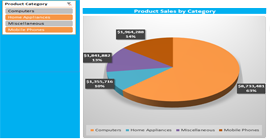
Create and enhance PivotCharts for powerful visual reporting |
| • |
Filter data using Slicers and Timeline tools to make your reporting interactive |
| • |
Use PivotTable specific formula to quickly summarize and extract your PivotTable data
|
|
 |
 |
 |
|
|
|
| • |
You will create visual and interactive layouts |
|
| • |
Learn and review Best Practices |
| • |
Link to external data using Excel’s importing tools |
| • |
Clean-up imported data using basic Excel macros |
| • |
Use sheet form controls and formulas to interact reports |
| • |
Display Metrics and KPI’s using conditional formats |
| • |
Use intermediate and advanced functions for ranking and summarizing source data
|
|
 |
 |
|
Contact us for more information or to enroll in this boot camp
Return to top of page.
Excel 2013 Training Class Outlines:
|


