 |
Excel Solutions Team|Computer Training Centers |
| Home | Training Services | Courses & Schedule | Consulting | Room Rentals | Locations | About EST | Contact Us |
713.589.2655
Houston, Texas
210.568.3904
San Antonio, Texas
| Course Links | |
| Resources | |
 |
|
|
| Power BI is Business Intelligence Like Never Before | |||||||||
|
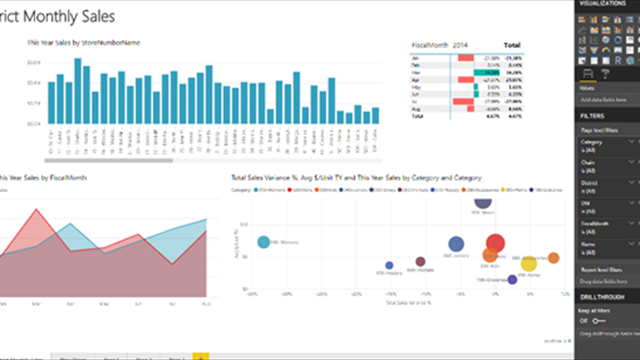
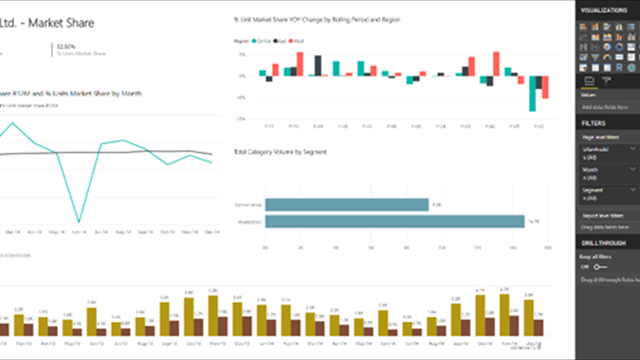
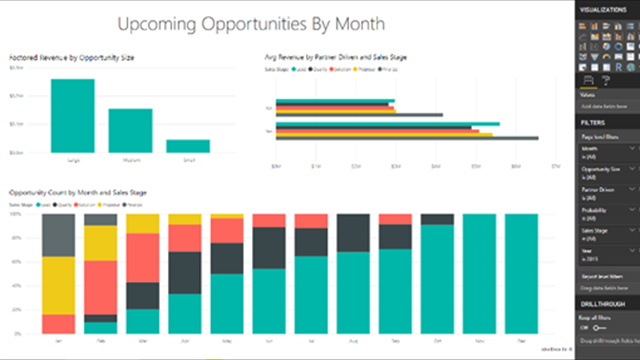
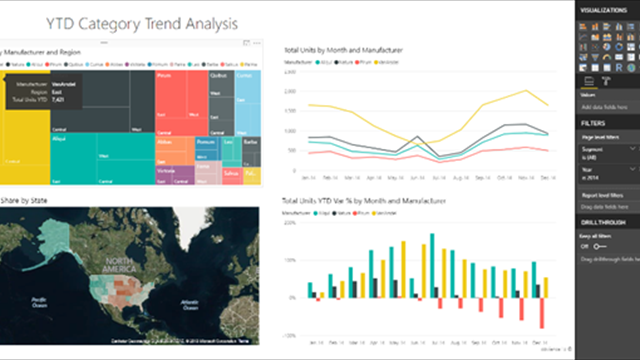
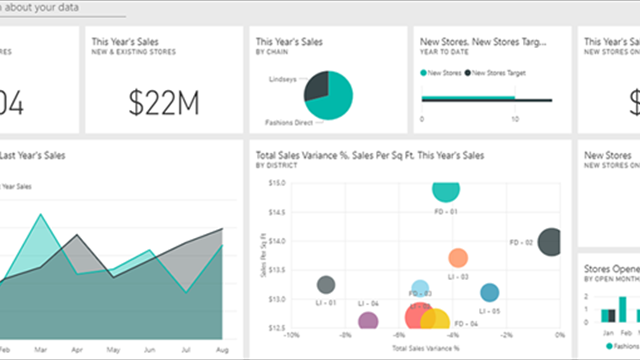
Power BI is a business analytics service that delivers insights to enable fast, informed decisions. Go from data to visual insights in minutes. Use any data, in any way, from anywhere. All in one view. Why Power BI? These tools enable the user to perform Enterprise level analysis at the End User level! Power BI is for Everyone, especially Analysts, IT Professionals, and Developers. View the Power BI Release Plan (2020-2022) created by Alex Powers from Microsoft so see what is coming soon to Power BI! |
||||||||
| It's All About Dashboards | |||||||||
|
|
|||||||||
| Power BI Desktop November 2021 Feature Summary | |
| This month, Microsoft's Power BI Team has added some exciting updates to the product. These include: • The New Format Pane (Preview) • New Format Options for Visuals • Power Automate Integration • View original blog post here Previous Power BI Update Blogs • October 2021 Feature Summary • September 2021 Feature Summary • August 2021 Feature Summary |
|
| Connect and Transform Your Data | |
|
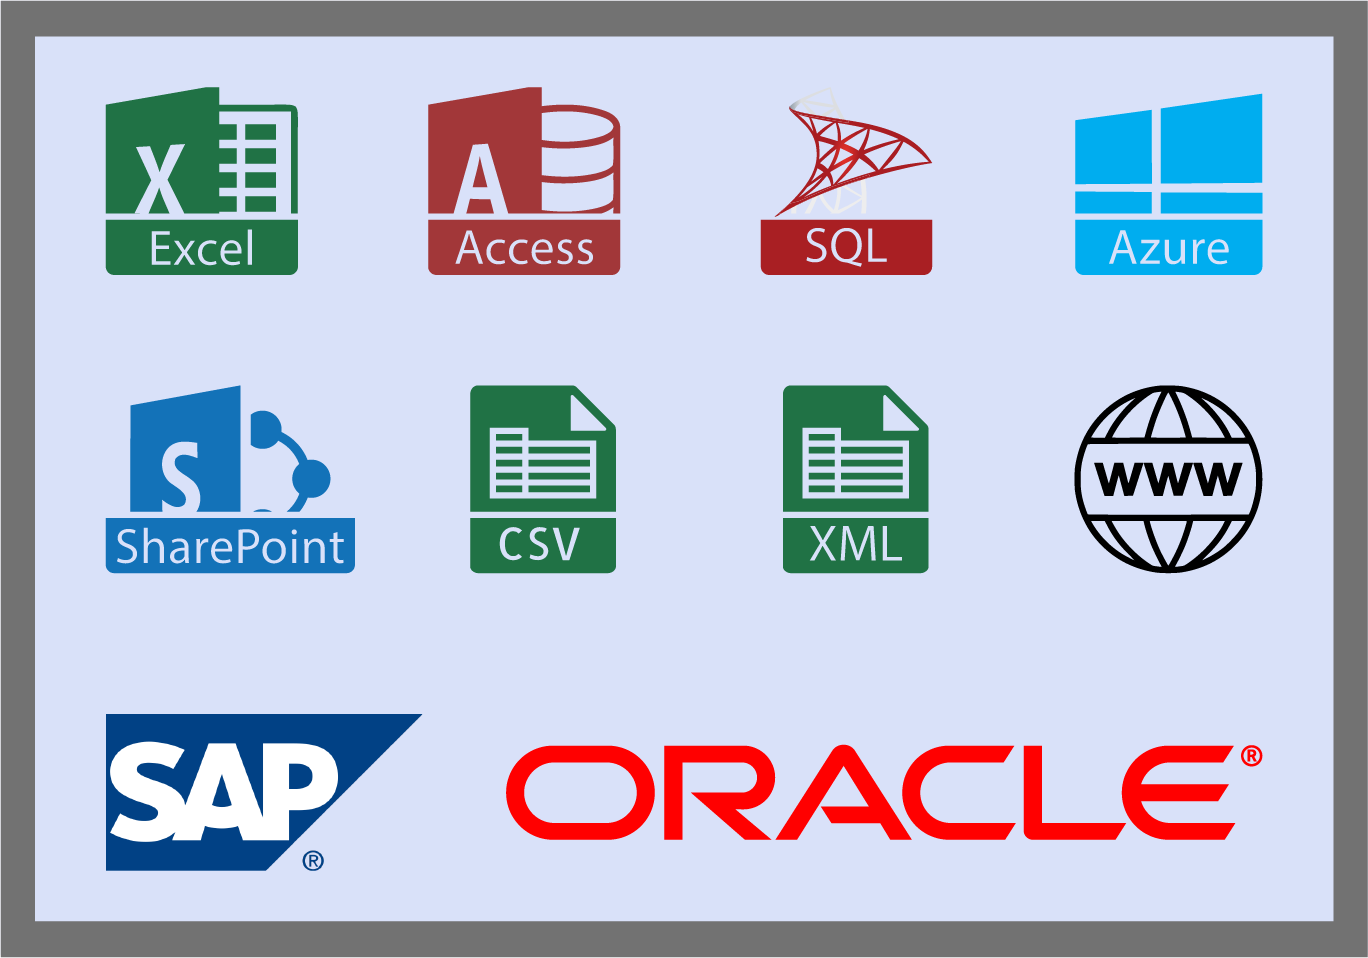
Power BI Desktop connects to data sources wherever they are, from the cloud or on premises, using sources like Excel, SQL Server, Azure, SAP, SharePoint and more.
Combine, transform, and organize massive amounts of data using Power BI Desktop's Query Editor at a fraction of the time and cost of other solutions. What happens when the source data changes? Once loaded, data only needs to be refreshed to stay up to date! |
 |
| Model Data with Ease using Relationships | |
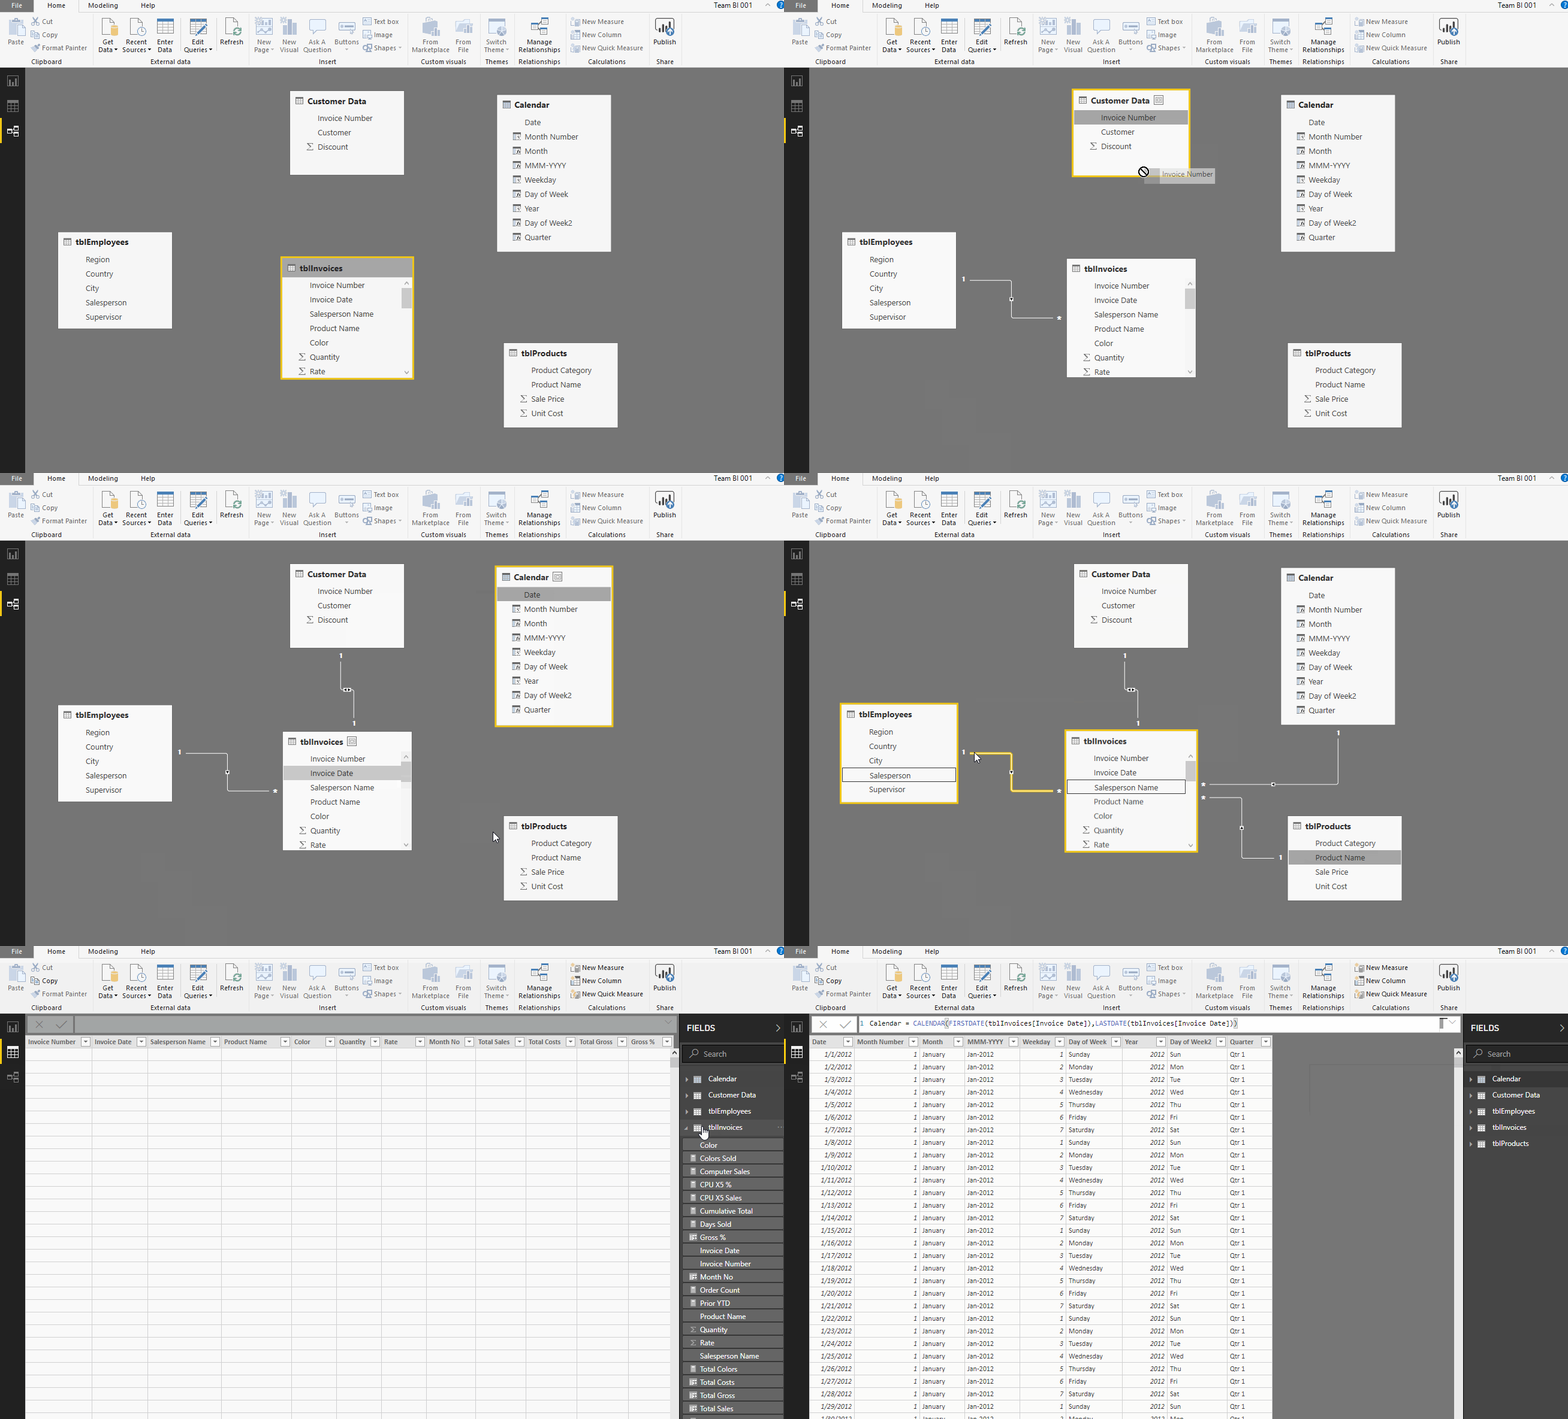 |
Power BI Desktop simplifies modeling of data, as you only need to prepare data once.
Data is stored in Tables, much the same as in a database or Excel. Because of this, data can be related between common fields, and all of the data can be used when creating Visual Tiles. Imagine no more VLOOKUPS! Relationships are created automatically by Power BI Desktop. Users can create them manually and adjust them where needed. |
| Provides Advanced Analytics with the Familiarity of Excel | |
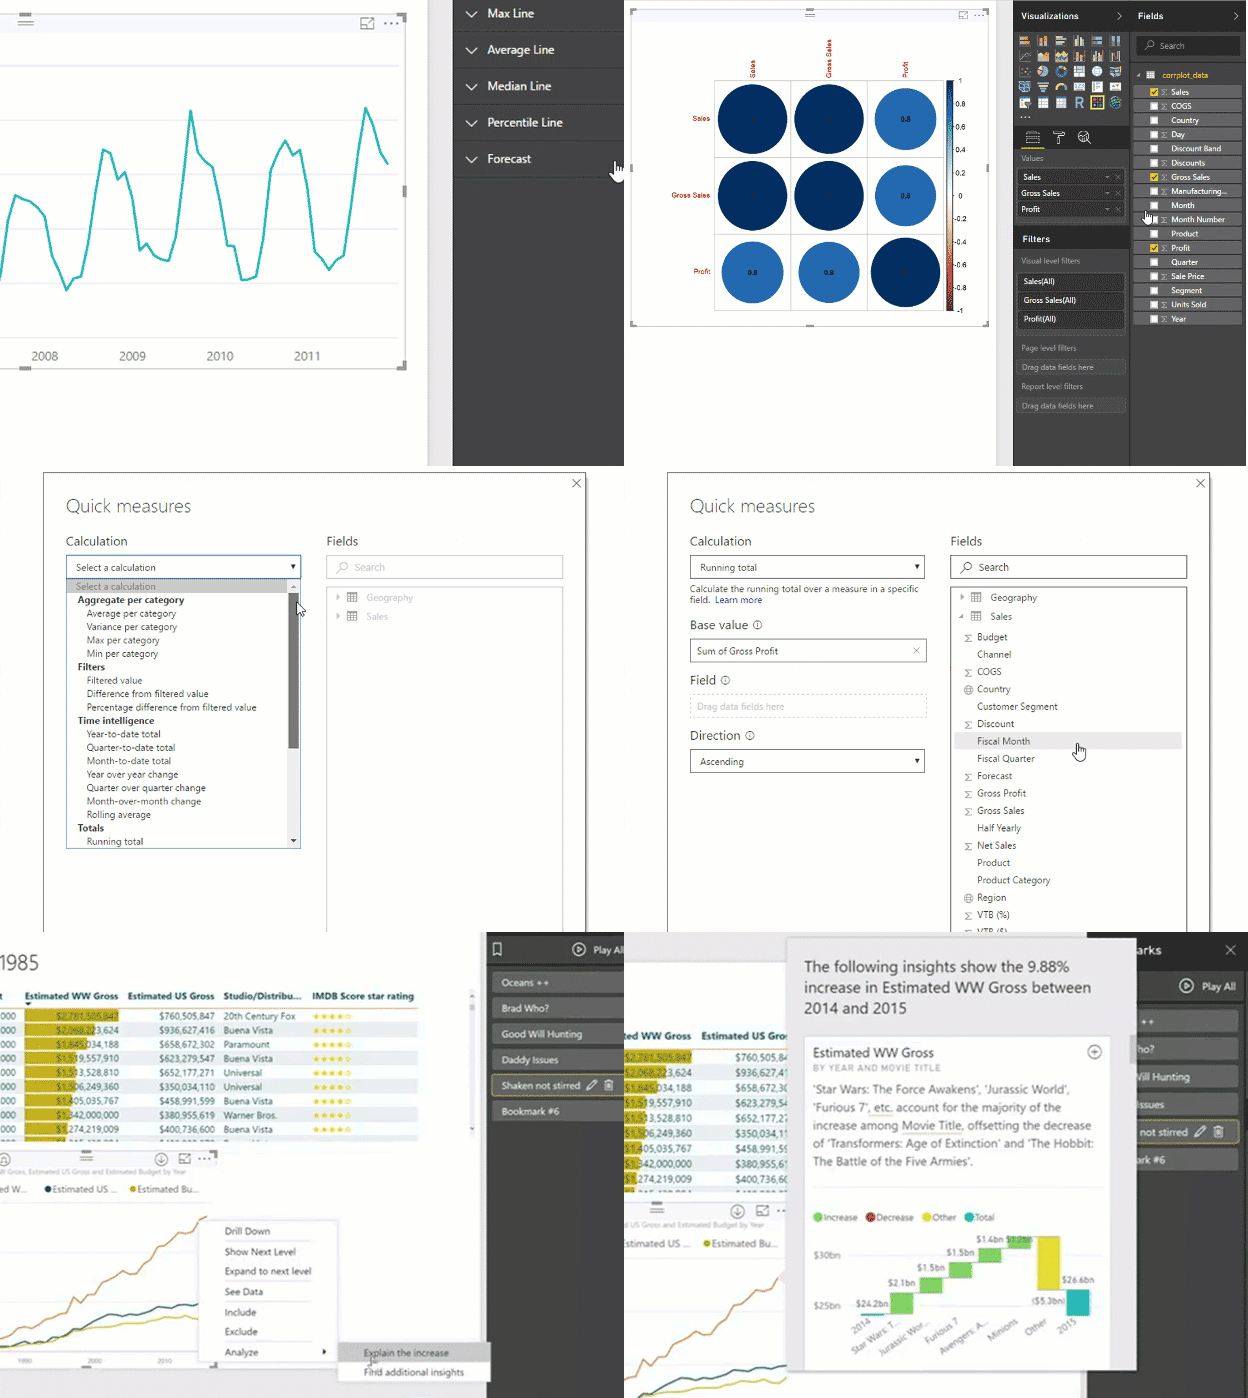
| Business users can now dig deeper into data to find patterns they may have otherwise missed. Power BI allows data to be summarized using custom calculated fields or measures. These features, along with quick measures allow data grouping, forecasting and clustering. Advanced calculations in measures can be created using DAX (Data Analysis Expressions). There are numerous DAX Functions that allow summarizations that can't be easily done in Excel. |
 |
| Publish to the Cloud and Share | |
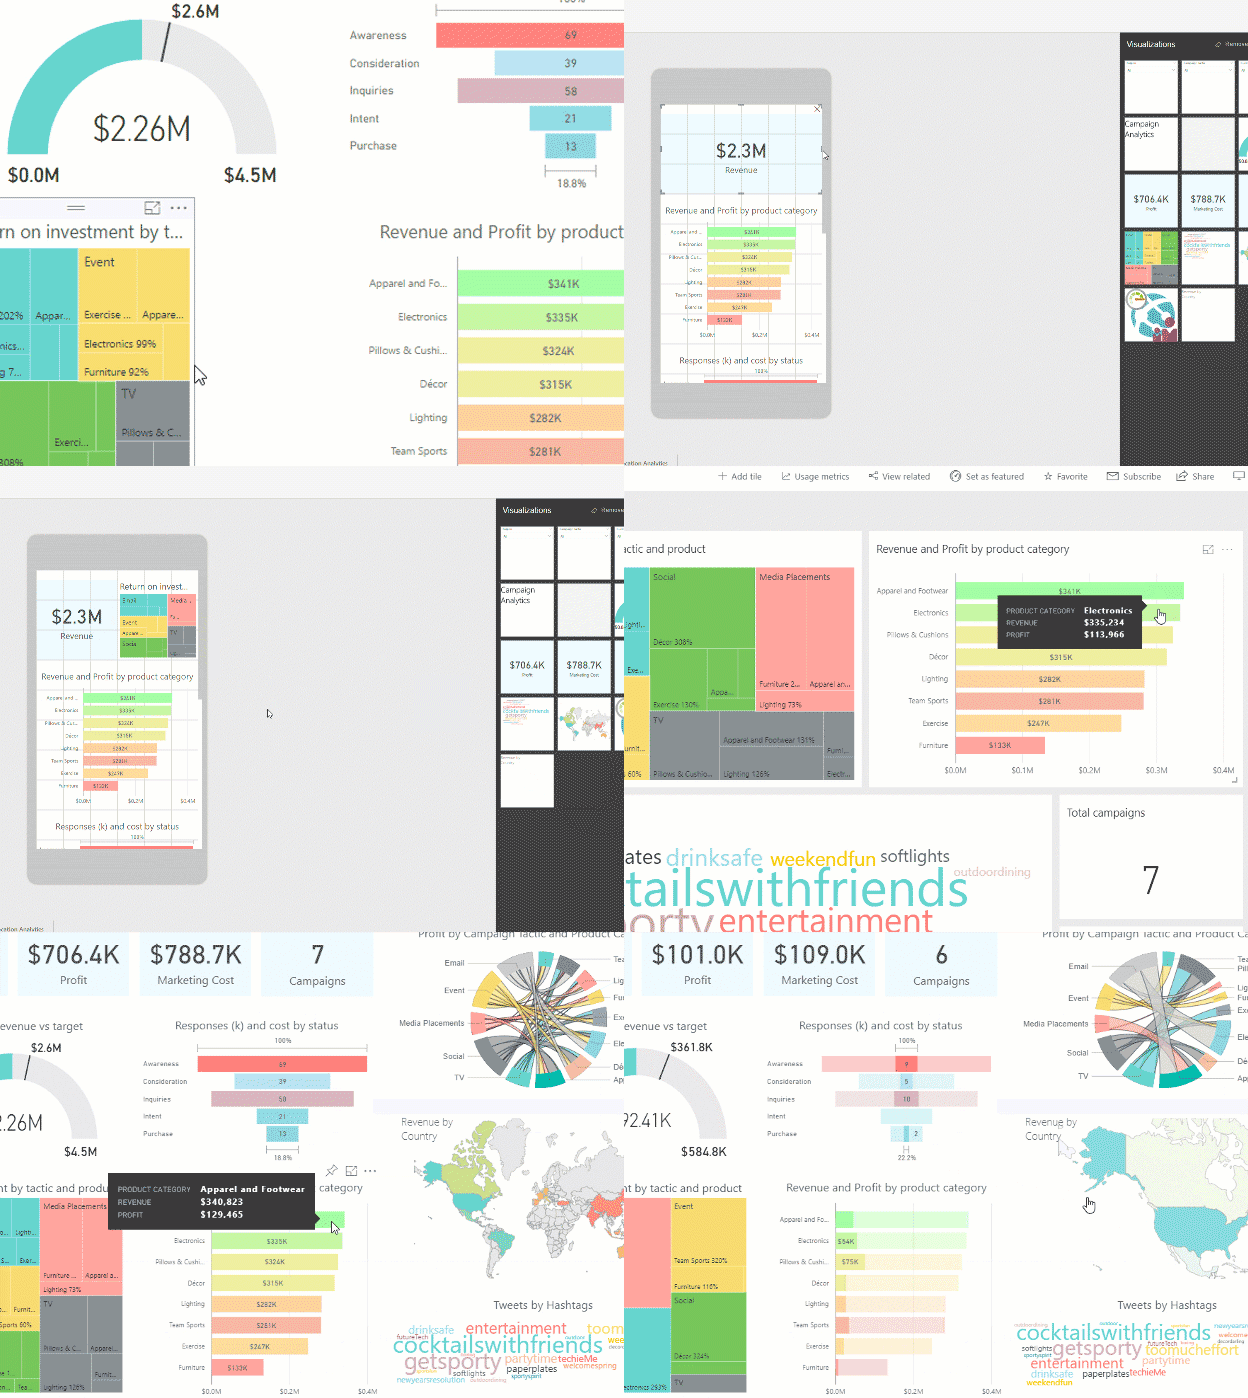 |
Empower data-driven decision making across your organization. |
| Quickly get your team onboard, as Power BI integrates with Office 365, SharePoint, Excel, Teams, and other familiar tools. | |
| Collaborate on reports and share insights with users across your organization. | |
| Distribute insights on any device in just a few clicks and manage user access and security from one central place. Users can publish to the Power BI web-service and set up automatic, incremental refreshes as well. | |
|
Stay up to date with everything Microsoft is doing with Power BI on their blog. |
|

 1
1 2
2 3
3 4
4 5
5